EURUSD Projection: Testing Key Resistance with a Downside Scenario
By: Davina Tan, Editor-in-Chief & Head of Technical Analysis TradeHub | Timestamp: July 21, 2026
Quantitative & Visual Indicator Analysis
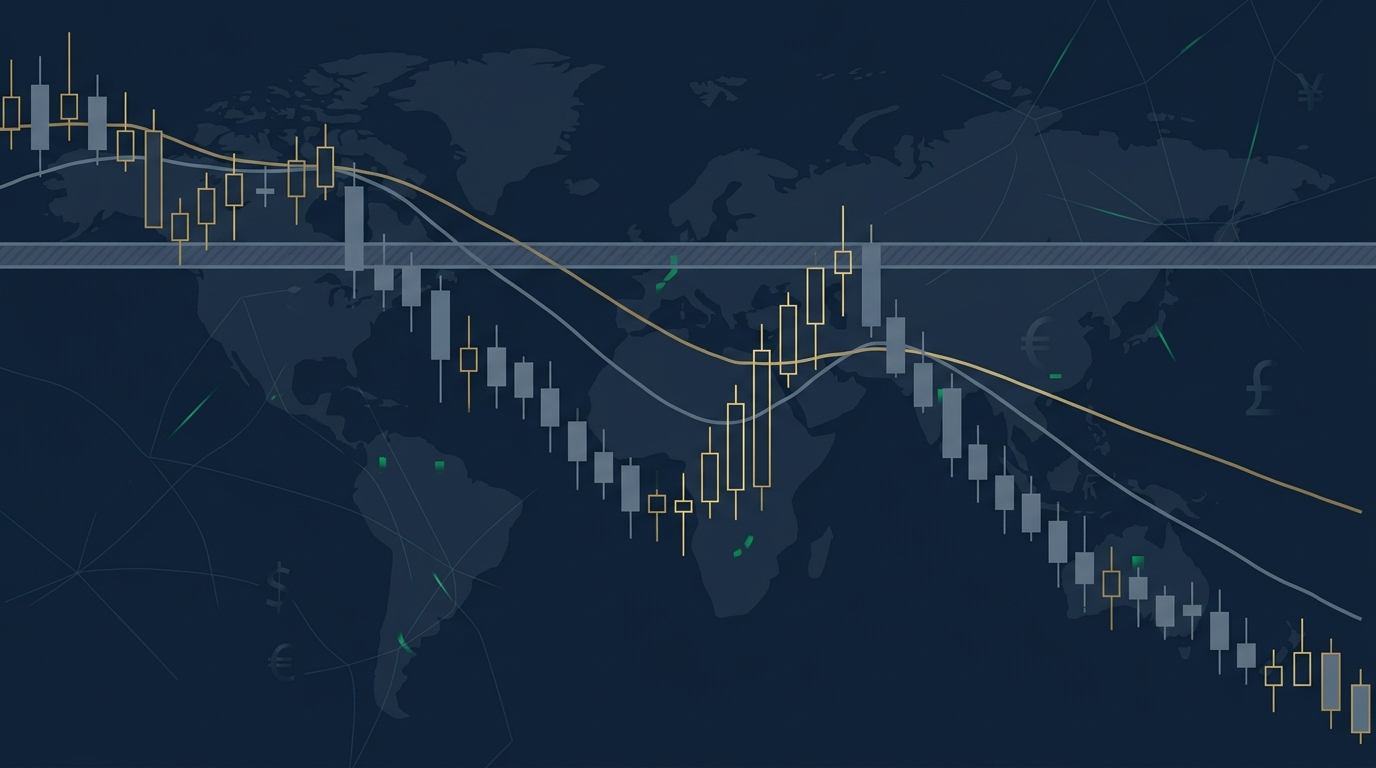
Based on visual analysis, the area worth paying attention to is the daily resistance between 1.1445 - 1.1485. We are projecting a high-probability technical scenario for further downside. Here is the breakdown:
- Price Action (Market Structure): A rejection wick is present at the resistance area. This indicates strong selling pressure.
- Momentum (EMA 8 & 24): The red line (EMA 8) is crossing downwards below the lime green line (EMA 24). Layman's explanation: The short-term average price is falling faster than the medium-term, indicating the dominance of selling momentum.
- Trend Baseline (SMA 50): The blue line (SMA 50) is being tested. The price is starting to press below this 50-period moving average, threatening the previous uptrend.
- RSI 14: This market saturation indicator is not at extreme oversold boundaries, leaving a fairly wide room for the price to drop further.
Executive Summary (TL;DR)
The EURUSD pair shows solid bearish indications for a swing trading approach based on the H4 and Daily charts. The price rejection at the crucial 1.1445-1.1485 level, supported by an EMA crossover (Selling Momentum), opens the door for a further corrective move. The ideal entry area is at the current market price, with a rational target at the nearest support.
All of this analysis is for educational purposes and does not constitute investment advice. Always manage your risk independently and consult with a licensed financial advisor before making trading decisions.
Market Structure Levels
Major Resistance: 1.1445 - 1.1485
Major Support: 1.13370
Invalidation: A daily price close above 1.14850 will invalidate this scenario.
Trade Scenario (Swing)
Order: Market Execution