TRADEHUB TECHNICAL ANALYSIS
EUR/USD Update
July 20, 2026
In-Depth Market Analysis
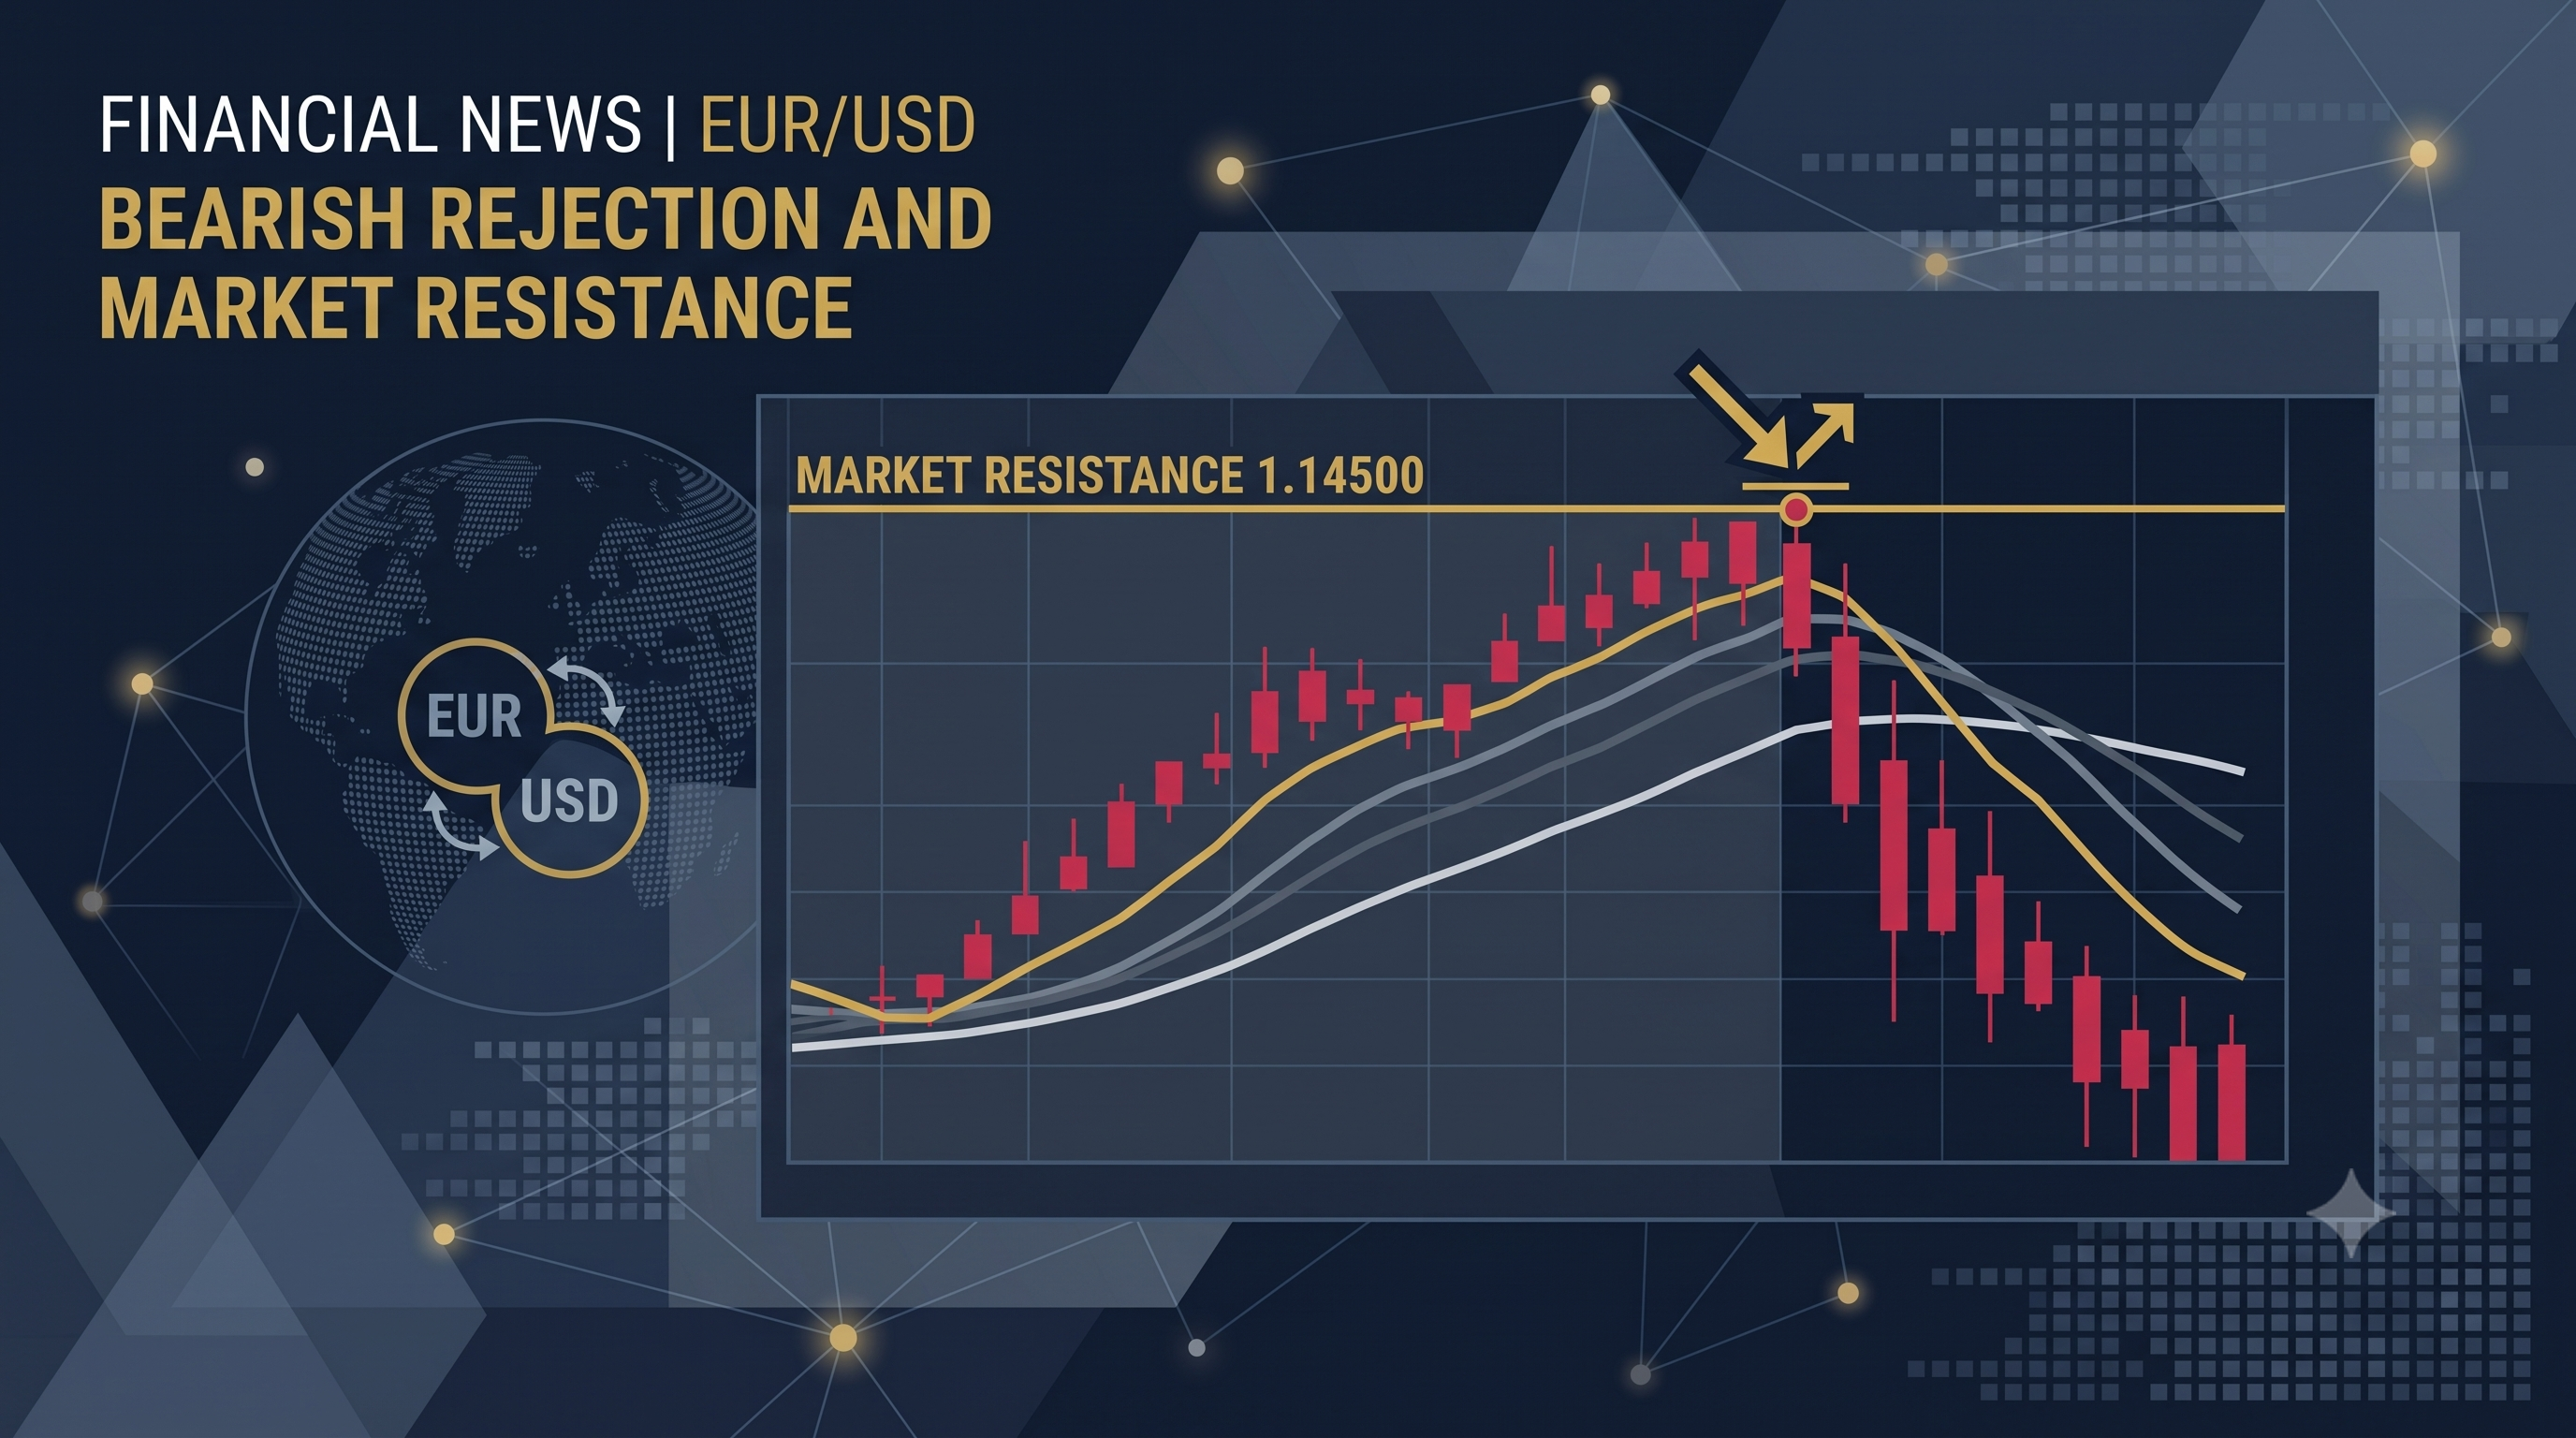
The EURUSD currency pair is currently approaching a crucial testing zone around 1.14500. Following a brief recovery phase from a prior decline, price action is now stalling near a technical resistance area that potentially serves as a rejection point for further movement.
Market Structure
Based on visual analysis, the area worth noting is the price structure on the Daily chart, which displays a dominant bearish bias (downtrend). The current rebound on the H1 and H4 charts is viewed as a pullback toward the nearest supply zone in the 1.14450 – 1.14550 range.
Indicator Quantitative Matrix
- SMA 50 (Baseline): Price is below the 50 SMA on the Daily chart, indicating the major trend generally remains downward.
- EMA 8 & 24 (Momentum): The flat crossover on H1/H4 indicates the market is in a consolidation (sideways) phase before determining its next direction.
- RSI 14: A reading in the 52-53 range shows relative balance between buyers and sellers. Not in the overbought or oversold zones.
Trade Scenario
The high-probability technical scenario is to capitalize on potential price rejection at the dynamic resistance zone by placing a pending order.
Invalidation Conditions
This selling scenario is rendered invalid if the price action breaks above the 1.14850 level and the candle closes consistently above this threshold (breakout).